Something I forgot to mention in response to your previous question, was in respect of comparing like for like against the stock torque figures.
If you look at the comparison graph above and taking 340lbft measure point (which is where the stock map is for the majority of it's run through the mid range) and compare the same measure point with Stage 2:
Stock reaches 340lbft @ 2600rpm
Stock maintains 340lbft till 6000rpm
Stage 2 reaches 340lbft @ 2100rpm
Stage 2 maintains 340lbft till 6700rpm
On a like for like measure point Stage 2 provides a considerably wider torque band, achieving the measure 500rpm sooner and lasting 700rpm longer.
It's worth remembering that any graph is about what's UNDER the curve, especially when comparing against previous states of tune.
Such a great write up and excellent information. Very informative, and that low down torque really wants me to get my car done too. Need to start saving lol. Thanks for the write up.
Any changes to the rev range will (I suspect) be dependant upon how the power band (peak power) is altered when we go to Stage 3. Assuming that peak power is made closer to the current rev limit, we'd probably look at altering that to suit. IMO, unless it's a track car, there is little benefit to raising the rev limit unless you're still increasing power at that point. The current turbo won't flow enough at the top end to warrant an increase at the current level imo.
Stage 3 will be turbo, spark plugs and probably induction / inlet. There is also another area we're going to look at, but I'll explain about this at the time when we start progression.
Shaun, thanks for further clarification, I suppose what I was getting at is that the increased low engine rpm torque is really useful when the engine rpms are low, with our automatic boxes that would be launching in first gear... Any time you are accelerating hard while moving you will be shifting at >6000 rpm, the stage 2 benefit here is around 40-60 lbsft which is still good but less than the mid range improvement. Increased low/mid range is also really beneficial on manual cars as there is less need to constantly hunt for torque through gear shifting (like my nat asp V8..)Thanks for such a great thread!
I managed to get back yesterday to Shakespeare Raceway and whilst the day didn’t entirely pan out as I had envisaged, I picked up some very positive performance data.
With poor track conditions, queues, bikes throwing their guts down the track and rain…. I effectively gave up after a couple of runs.
I’ll get this out of the way first….. I didn’t better my previous 11.80s ET. You’ll see further on it’s not always just about the ET for performance data comparisons.
I always knew I was going to struggle with grip off the start. I was struggling at Stage 1 and with Stage 2 we’re now producing more torque and faster. This was further amplified by the start line prep….. It was bad. Many other runners (including a few of my friends that turned up) on street tyres were struggling.
To make the situation even worse the organisers then decided to keep gluing the track up throughout the day. We saw them redress the surface 4 times. I suppose with the oil being thrown down by some bikes and cars, they had to do it after cleaning up.
Every time this happens for street tyres it adds drag which makes us slower (my speeds were dropping as were others, as the day progressed). I suspect this was due to all the bikes running yesterday, especially with the track surface temps being quite low as well.
There is nowt you can do though…. It is what it is.
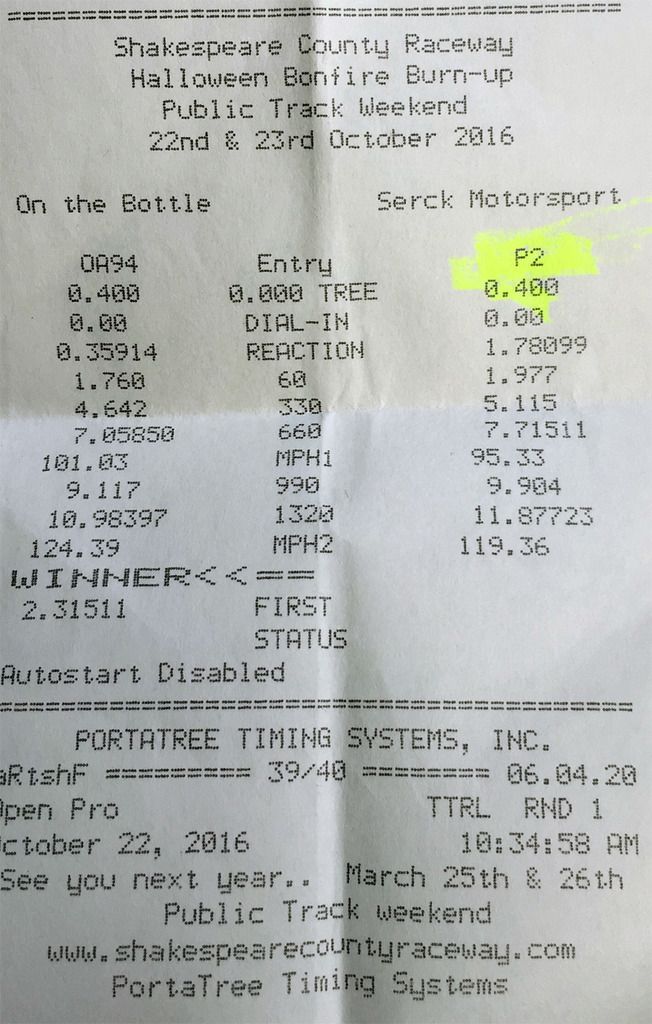
This was the best time achieved yesterday:
Anyone that knows what they’re looking at may now think “Mmmm… that looks interesting!!”.
60ft
This is one of the key indicators of launch grip.
At Stage 1 when we achieved the 11.80s pass the 60ft was being seen in 1.80s. This run was showing a very poor 1.97s. That’s how bad the launch grip was.
From my past experience any reduction in the 60ft time will see at least the same reduction at the ET.
To get the ET achieved here, with that kind of 60ft is bloody good and alludes to how much more potential the car has in it’s ET times.
Some form of logic dictates that if grip had been sufficient to achieve a 1.80s 60ft, the ET’s could have been 11.7’s and maybe even a very high (11.69) 11.6’s.
1/8m MPH
At Stage 1 we were seeing 92.74mph at this part of the fastest run. On this run at Stage 2 we’re seeing 95.33mph. This is the first indication that Stage 2 (dyno figures to one side) is clearly producing more power. More BHP will see higher trap speeds on a like for like car (as in weight).
1/4m MPH
At Stage 1 we were seeing 116.10mph at this part of the fastest run. On this run at Stage 2 we’re seeing 119.36mph. This again shows that Stage 2 is producing more top end grunt, which is what was shown on the dyno graphs.
To have trap speeds at this level for this stage of tuning on the RS3 8V is extremely good.
So what!?
Apart from the logical theory of the 60ft times and impact this could/should have on the ETs, what does all this MPH increase really mean?
It should mean that the car, after launching, is quicker than Stage 1 in and through the gears. Let’s see if that is the reality…..
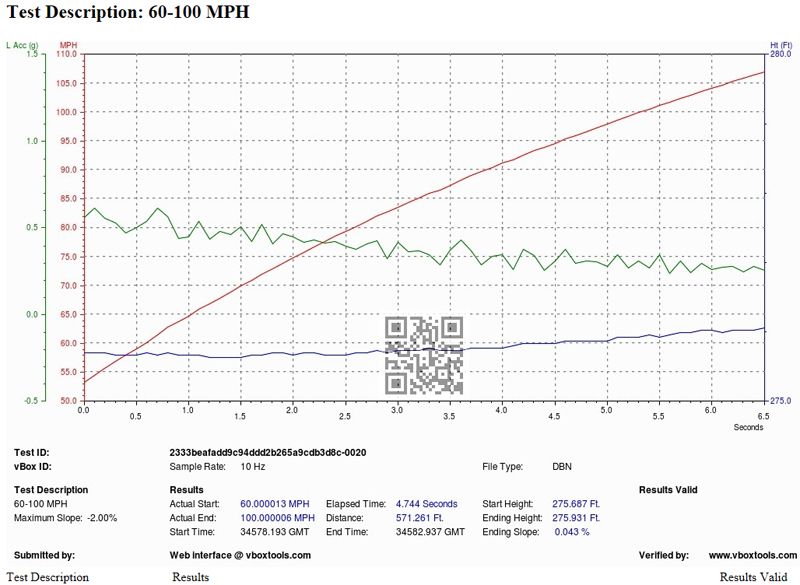
All this data is from the same run as above. I’m not picking and choosing!
There is no point me comparing 0-60 against Stage 1, as this is where traction was bad at Stage 2 yesterday. Stage 2 was slower than Stage 1 by 0.23s because of these launch traction issues.
60-100mph in 4.74s
This is 0.34s quicker than Stage 1.
Seeing as this had dropped a fair whack, it would be interesting to see if the 0-100mph was better, even though we knew 0-60mph was worse because of traction issues.
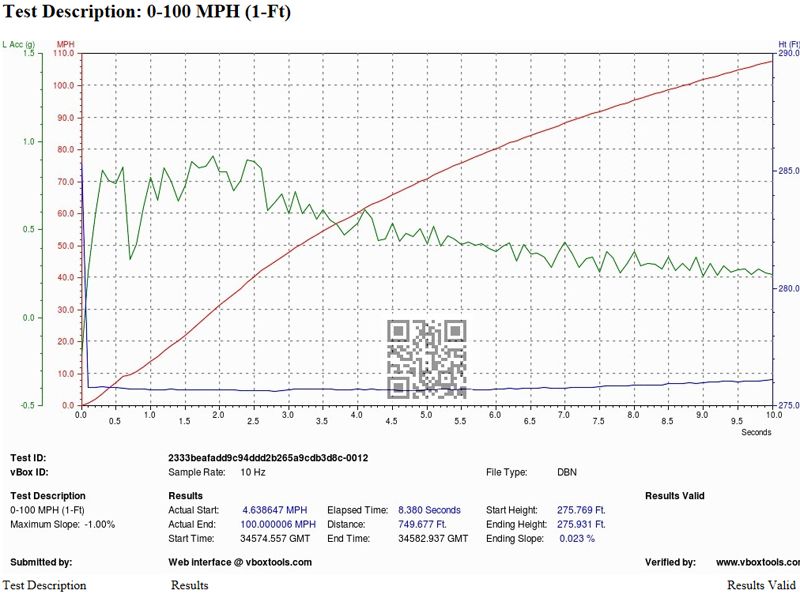
Not bad for a shopping car with some bolt ons and a remap. lol
0-100mph in 8.38s
This is 0.11s quicker than Stage 1 even with worse traction at the start (that lost it 0.2s)!!! That starts to tell you how much quicker this car is now.
With better launch traction I would imagine this time could be reduced further by a couple of 10ths.
When VBOX “Verified” graphs do not always tell the TRUE picture
I’ve previously said that comparing figures between a drag strip and road run are, in my opinion, not always comparative. So you need to be wary of this. On road tyres, runs on the strip tend to be slower (especially through and in-gear) than on the public road due to the increased tyre drag on a prepped drag strip surface.
One thing I’ve touched on before is the impact that “slope” (uphill or downhill) can have on acceleration figures. It goes without saying that with all things being equal if you accelerate uphill you’ll be slower, and if you accelerate downhill you’ll be quicker.
Whilst VBOX Verify (as in the charts you’ve seen in my posts), check that the datalog has basic integrity, it also checks for slope %. If the slope is outside of its specified tolerance, it will state the run is “Invalid”. You’ll see that all of my runs are marked up as “Results Valid”.
You would assume that because VBOX Verify has deemed your run as valid that’s all cool and we can compare apples with apples. In a word….. No.
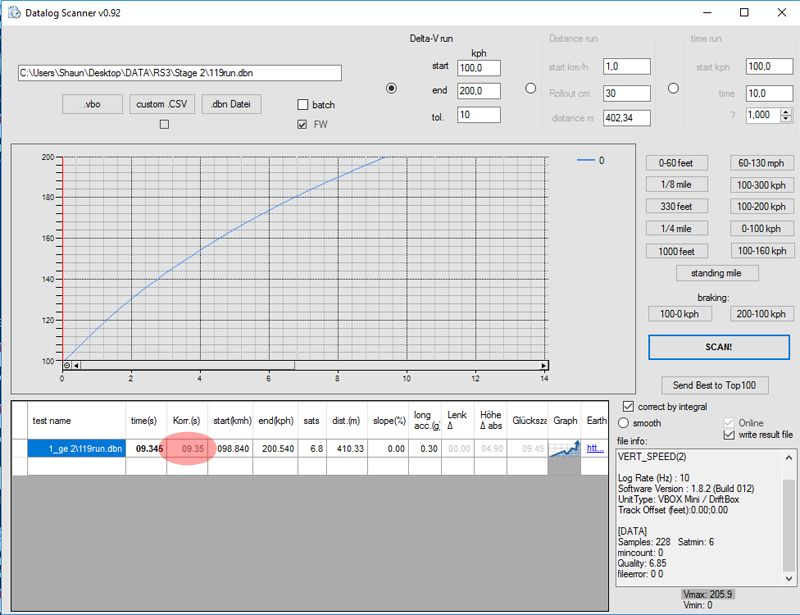
You can also use a piece of software called “DBScanner”, which actually “corrects” the performance based on the slope that is recorded within the VBOX data. It effectively corrects the figures as if the run was on a flat piece of road.
This is only a calculation and I don’t know what wizardry it uses to do that. Quite a few people all over the world are starting to use this method now, as it is clearly apparent that there are differences and they can be quite considerable….. VBOX Verified or not.
I have a shedload of VBOX logs from all sorts of cars and owners. I’ve seen variances of up to 0.5s in figures between VBOX verified runs and what they have been corrected to using DBScanner. As in VBOX Verify giving a quicker figure than what DBScanner does.
I can’t emphasise this enough….. If you compare my data with anyone elses, make sure it’s like for like. Based on the comparison data I have (other tuned RS3’s which has been verified and corrected)….. This Stage 2 is properly quick.
Of course my data is from a drag strip which is a known entity and UPHILL!
And finally….
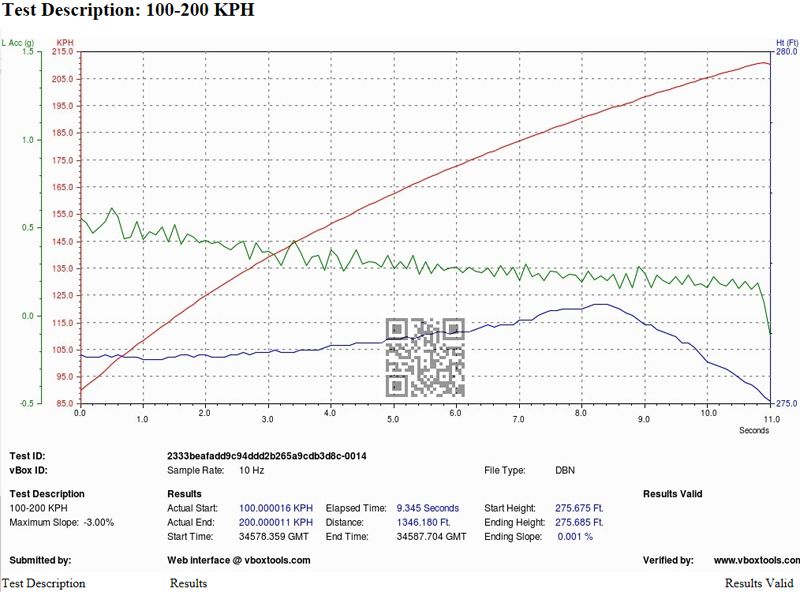
Since my terminals were up as part of Stage 2 benefits and because some of the whatsapp crew have been banging on to me about getting some 100-200kmh times (this appears to be a standard measure of through the gears real world performance - 62 to 124mph), I kept my “foot in” at the end of the drag runs yesterday.
100-200km/h (62-124mph) in 9.34s
There is a very very slight downhill slope just after the end of the 1/4m at the strip (-1.5ft lol), so the corrected figure via DBScanner gives a figure of 9.35s (see below highlighted).
Again, based on the corrected data I have from others………. This time is very quick for this level of tune on the RS3 8V.
Just one LAST thing….
Although I didn’t manage to achieve the ET I was hoping for yesterday, hopefully all the other data that has been gained shows that Stage 2 has certainly made the car quicker / faster.
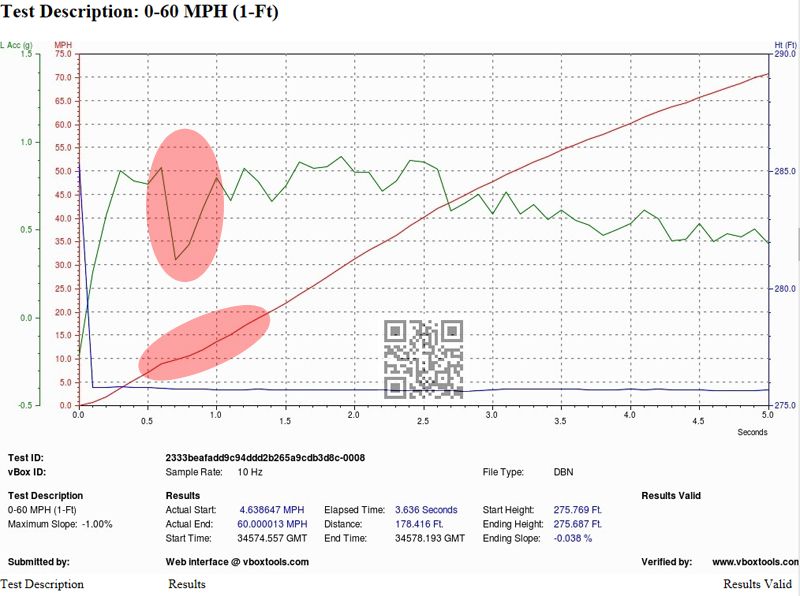
I know I keep banging on about traction issues and perhaps some of you will think I’m over egging this…. So here’s some more data to back that up:
This is the 0-60 VBOX graph of the same 1/4m run being used throughout this update. As you can see it’s a poor 3.63s. Lol
If you look at the parts I have highlighted you can see where the speed has dipped from around 9mph and the G’s fall right off. This was the area I lost the time due to traction issues.
I filmed my runs yesterday in-car and you can actually see what’s going on with the boost and revs during this part of the run.
If you look at the dash when I’m launching you’ll see the TC light come on, then the revs and boost drop and then it picks up. It’s quite obvious that’s going to be impacting my 1/4m times.
I’m not sure whether this is being invoked due to the lack of traction, or whether the car now needs a DSG remap to cope with the extra torque on launch, or whether we need to alter the launch strategy.
We’ll look into this more with Stage 3, but since this is a road car it’s not really an issue to be honest. This does not happen in any other scenario apart from when using Launch Control.
So will you be going for the optional 255/30/19 on the 8.5J rim for more front end grip?
That would be a last resort I think and in all honesty I don't think I'll need to go down that path for Stage 3. I can't divulge details at the moment, but all will become clear when I get on with the next round of mods.
Just push the ESP Button longer to switch it completely off. I have the same problem.
With traction control set off, the wheels are spinning the complete first gear.
We will lower the boost in first gear to get more traction.
Here is the graph to my Stage 2:

 Sign In
 Create Account


 Back to top
 Quote
Quote MultiQuote