
 Sign In
 Create Account
Hi Shaunee, I read that you use the long life oil but I wanted to know please how often you change the engine oil? Are you on a fixed or variable service interval or something else?
My car is set to variable and is coming up to having done 5k, I don't like the idea of keeping the same oil for 18k miles even though I do cover around 18k - 20k pa!
Cheers Rich...

RS3 8V: One step at a time
Started By
Shaunee
, Aug 14 2016 01:26 PM
535 replies to this topic
 Back to top
 Quote
Quote MultiQuote
#42

 Posted 27 August 2016 - 05:46 AM
Shaunee
-
- Valued Member
-

- 609 posts
Valued Club Member
Hi Shaunee, I read that you use the long life oil but I wanted to know please how often you change the engine oil? Are you on a fixed or variable service interval or something else?
My car is set to variable and is coming up to having done 5k, I don't like the idea of keeping the same oil for 18k miles even though I do cover around 18k - 20k pa!
Cheers Rich...
Hi Rich,
My car is on the fixed schedule and I'll being doing around 5k per year normally. It will be serviced once a year.
In your case, I think it all depends how you use the car..... however, the Audi system is variable dependant upon use etc, so why not just let it do it's thing.
#43
Posted 28 August 2016 - 09:47 PM
GingeRS
-

- Valued Member
-
- 627 posts
Valued Club Member
Been in hiding for a while so missed quite a bit of discussions etc. This thread is one I'll be paying particular attention to whenever I get the chance to make an appearance. Look forward to further progress and reading your intensively in depth and detailed write ups. Excellent work so far mate.
#44
Posted 02 September 2016 - 06:24 AM
Shaunee
-
- Valued Member
-
- 609 posts
Valued Club Member
Quick update on what's what with the first round of performance mods fitment and testing stage.
Somebody didn't realise that last weekend (when I had planned / booked dyno and workshop time) was actually a Bank Holiday.  This session has now been rebooked and will be taking place this coming Wednesday. I'll aim to publish all the gory detail of how this goes, by the end of next week if at all possible.
Following this initial tuning exercise the plan will then be to take the car back to Santa Pod on the 17th September to see what, if any, improvements have been made down the quarter.
#45
Posted 05 September 2016 - 08:52 AM
jasbo1977
-

- Valued Member
-
- 132 posts
Member
Cool thread ithink shaunee must have more time than the rest of us put together haha
#46
Posted 08 September 2016 - 07:41 PM
Shaunee
-
- Valued Member
-
- 609 posts
Valued Club Member
Preamble - Performance Tuning
First off I would like to underline a key point. I’m not suggesting at the moment that I’m going to find out anything new or revolutionary. A lot of the initial steps I’ll be taking will undoubtedly be exactly the same as others have done before me. But I need to do it “one step at a time”, because that’s the way you learn using a pragmatic approach.
If you’re looking for “just” power graphs and peak figure talk….. whilst you’ll find that information here, this is really not what my project thread will be about - there is a lot more to modifications than just using these two elements as reference.
If I have one “mission” in life, that “mission” is to keep highlighting that on their own, peak figures mean diddly squat. If you just skim read this project, focussing on peak values and comparing those with other peak values (from others achievements), you are in my opinion, missing valuable context. Peak figures do not make for a quick car, and they certainly don’t tell you what you really need to appreciate. Peak figures are for the pub - and the next round won’t be on me!
You best get your empty plate ready, grab some salt and pepper, tuck your napkin in under your chin and prepare yourself for a mammoth “eat as much as you like” experience!!
I want to understand the detail of why and how, which will hopefully allow us all to understand how things could be improved and what is potentially looked at next in the journey.
First thing is to state is that Litchfield Motors will be the key company I’ll be working with at this stage. They have worked with me on three previous projects (two Subaru’s and my previous A45 AMG) since 2005, and they’ve always come up with the goods for me.
Performance measurement and tuning aids - Rolling Road Overview
Perhaps the single biggest bone of contention is how I would decide to measure/test for any increases (and of course decreases) in power, when looking at engine modifications. Several ways exist, namely use of a Rolling Road, Engine Dyno, Performance Meters and the regularly used “arse dyno”.
For the purpose of engine based modifications, stats will be attained by use of a Rolling Road, coupled with real driving feedback on the road.
Even though we may all agree that various rolling roads will give different readings, and the arguments that RR figures at X are incorrect and RR figures at Y are correct, is meaningless to a degree.
Although many conditions even on the same rolling road can cause changes in figures, we need something we can use to compare with accuracy and repeatability. Obviously the more conditions you can stabilise the more your figures will be representative.
Now, before I explain things further it’s probably worth me stating one thing here and now. I’m a self confessed “dyno queen”. At a guess, I suspect I have had well in excess of 500 runs on various dyno’s over the years (I wouldn’t actually be surprised if it’s closer to 1000 runs).
Even though I’m just a member of the Joe Soap gang, this number of runs on various dyno set-ups across the UK has provided me a vast amount of knowledge around this area. I’m sure we’ve all seen the arguments about which ones do or don’t over read. How important wheel horsepower is and how inaccurate flywheel horsepower is!?
Let’s get one thing straight…. a dyno is a tool, and if used correctly, a very valuable tool.
For the pub talk fanatics out there you know which type of dyno to go to, to receive inflated figures. If that makes you feel better, bully for you….. it’s your money and your ego. Personally, I place more emphasis on accuracy and repeatability.
Remember... there are lies, damn lies and dynos!
I could tell you heaps of ways that I could alter the way a car was run on a dyno, that would influence the figures obtained. Be rest assured that this is all about being “real” from my perspective. I have nothing to gain from presenting inflated figures, and it’s certainly not something I suspect you want to see.
If you are not already aware, power figures on Rolling Roads are normally part measured and part calculated. For the purpose of this project we will be showing flywheel BHP and torque figures. The core reason behind this is that here in the UK, that is our normal method of measurement. Some people will suggest that wheel horsepower figures are the be all and end all. I totally disagree in respect of chassis dynos. Like flywheel figures, wheel horsepower figures can also be up for a “slagging”. Different chassis dynos will undoubtedly produce different wheel horsepower figures. Why? Well it’s to do with the physical makeup of the dyno, like the rollers used and how all the “gubbins” works to “measure” the power. I could then start to talk about tyre deformation and the effect this has, but I suspect that will send you to sleep.
Some others will then take the stance that it matters not what figures the dyno produces, it’s the difference of the before and after in percentage terms. With people using those % differences as a defacto way of measuring performance. You have to be open minded about this as well, as you’re assuming conditions are like for like and that the power reported is based on linear measurements on a like for like basis, with the previous run. You can not guarantee that, especially when you’re using a dyno setup that you already know provides inaccurate data.
It makes absolute sense to start off with a dyno that you feel provides accuracy from the get go. It makes no sense to start off with a dyno that you already know provides inflated figures. This is assuming you want a level of accuracy in respect of figures attained….. although there are other key (and more important) reasons why a dyno provides a worthy advantage to tuning overall. This is something that will be explained further at appropriate points in this project.
Performance measurement and tuning aids - Which type of chassis dyno?
OK…. so I want to use a dyno that provides accurate (within context) flywheel figures and repeatable results. But what about the known issue of Haldex transmission and dynos?
The RS3 uses a Haldex system to manage traction (torque balance) between the front and rear axles. Predominantly the system is front wheel, but has the capability to shift torque to the rear axle, when it detects slip at the front. So why is this a potential problem?
Since the Haldex system can and does switch to 4WD, you need to use a 4WD dyno for starters. I know some people have forced 2WD, but that’s certainly not indicative of what the car will do on the road.
Many 4WD dynos have locked front and rear rollers (resistance wise), which for a permanent 4WD system (like on a Subaru) that’s all fine. For a Haldex equipped car….. that’s potentially very bad. In basic terms, running a Haldex car on a non-Haldex compatible dyno can result in damaged transmission. You need to use a dyno that is able to adjust resistance as required, between front and rear.
So let’s assume we have that situation covered with the dyno choice made.
The “cell” in which the dyno is located is also very important if you want to maintain accuracy and repeatable results.
Airflow is paramount in achieving both accuracy and a level of safety of your vehicle during dyno use. A dyno is a VERY harsh environment for your car, so you need to ensure that the best environment within the cell is provided. Decent airflow not only helps with replicating (as best as you can) road conditions, but also ensures appropriate airflow assists cooling. A properly constructed dyno “cell” will support these requirements.
There are so many so called “cells” that are effectively in part of the workshop. You’ve seen them. Big open spaces and very high ceilings. Trying to control airflow and pressure in a large space is going to be extremely difficult, if nigh on impossible with the majority of fan and exhaust systems tuners use. The smaller the “space” (cell), the better the environment can be stabilized and controlled, with appropriate fan and exhaust systems shifting huge amounts of air in and out.
Taking all of this into consideration, and based upon my previous experience of using this type of dyno (to appreciate it’s repeatability), I’ll be using the latest MAHA MSR dyno.
An added benefit of the MAHA is that it measures coast down (transmission drag) to derive a flywheel BHP figure (wheel figure + coast down). On a chassis dyno this is the only way to more accurately measure transmission losses. Forget the “fixed %” that is used by so many…. drivetrain losses are not linear. Just think about heat build up (friction/drag) in your drivetrain, which builds as torque is created. The higher the temps, the more friction and greater the losses.
Performance measurement and tuning aids - Racelogic VBOX
We know (well…. I hope we do!) it’s not all about dyno figures, and whilst I’ll be explaining how you should dissect a dyno graph to gain the important information (and that’s NOT going to be about peak figures in isolation), we really need to gauge performance on the “black stuff” surely. Part of this will be completed via road driving feedback, but that can be subjective to a degree. What we really need is another “measure” to compliment ALL the information that is being gathered.
Performance monitoring as regards to recording 0-60, 0-100 & 1/4m times was historically a bit hit and miss as far as the high street consumer has been concerned. Whilst a number of solutions have existed that are very accurate, the costs involved with these solutions had always been out of reach, except for those that require such equipment for official testing and have the budgets to substantiate such equipment.
With the advancements of GPS and the keen pricing of such equipment to the general consumer sector, a new solution appeared on the market a few years ago, that now makes this kind of performance testing, both extremely cost effective and accurate.
RaceLogic have constructed an all-in-one solution that combines a single unit that not only houses all the sensors, GPS receivers and built in screen, but it also gives the ability to log results which can be stored on a memory card and later read and analysed using some very powerful software supplied. All you need is a *** lighter socket (for power) and off you go…… sounds too simple to actually be true and accurate doesn’t it….. well let me assure you it is certainly both simple to use and very accurate. I’ve personally been using these devices for years, attaining “figures” and times which have been referenced against specialist and very expensive timing equipment.
My weapon of choice is the Racelogic Drift Box.
Firstly don’t let the name Drift Box put you off….. this little box of tricks is far more than a box that shows you drift angles!
For the purpose of this project and testing, I suspect we will be concentrating on the uses of the Performance Meter, Lap Timer and Data Logger.
Performance Meter
With the DriftBox it is very easy to measure acceleration times, braking distances, quarter miles times and much more. There are a number of configurable screens that show specific test results such as 0-60, 0-100, 0-100-0, 1/2 miles and ¼ mile etc.
DriftBox is based on the Racelogic VBOX, which is used by the majority of car manufacturers, tyre manufacturers and car magazines around the world to assess performance.
Because it is very easy to edit the test ranges, DriftBox is a very powerful tool for use in many different kinds of vehicle testing.
Lap Timer
Displaying your lap times as you drive around a circuit is simple with DriftBox. You can display your current, last and best lap times, and also display split times for up to six specified split points around the lap.
Through the DriftBox forum you are able to download circuit overlays from around the world, compare lap times, and share lap overlay data with other users.
Data Logger
Every item of data that the DriftBox displays (and loads more besides) is logged and can be recorded on a SD card. This can be read in to a PC at a later date to analyse. The piece of software that comes with the DriftBox to enable this function is very powerful indeed, giving you many different tabular and graphing facilities to display and compare the information captured. The software will even enable you to "play back" captured data sets on screen.
How accurate is it?
Amazingly accurate!!!!!
The lap timing mode proved (based on my testing) to be within .1 seconds accuracy of official track timing equipment.
The performance meter proved (based on my testing) to be within .1 seconds accuracy of several FIA approved drag strips for the 1/4m.
I say all of this I now need to buy a new one as mine appears to give me results that are much slower than real. lol It’s only recently developed this fault…. Being over 10yrs old probably doesn’t help and it’s been dropped a few times. That’s another £500 to fork out then!
Right…. that’s enough “rice” for the entree.
You best visit the toilet for a bowel movement and make some space for the main course (some fitment and testing of tuning products), which will be up for “tasting” shortly!
See you in a couple of days.
#47
Posted 08 September 2016 - 08:19 PM
Fivepotfan
-

- Valued Member
-
- 868 posts
Valued Club Member
- LocationSouth of somewhere
Holy Cow this is gonna be good.
Don't know about the rest of you guys but I am hooked already - bring on the next installment.! 
now driving a 'Daytona Lite' FL car.
#48
Posted 08 September 2016 - 09:24 PM
Shaunee
-
- Valued Member
-
- 609 posts
Valued Club Member
I spent all day in the dyno yesterday and I'm back again this Saturday for more testing.
So much left to do though.
Hopefully the next update will be up soon after.
Sent from my iPhone using Tapatalk
#49
Posted 08 September 2016 - 09:40 PM
B-100
-

- Valued Member
-
- 58 posts
Member
- LocationBristol
I've never seen anyone go into the depths you are, it's great! Are you going to log any 30-60mph, 40-80mph times etc? I'd be really interested in those as that's where most of us will want to feel a 'usable' increase in performance
#50
Posted 08 September 2016 - 09:52 PM
Shaunee
-
- Valued Member
-
- 609 posts
Valued Club Member
TBH I don't really bother with those bands. It's normally 0-60, 60-100, 62-124 and quarter mile. I can of course add to this if it would be useful.
I've gotta put my hands up and say I never got these logs when the car was stock, apart from the drag runs. I have got data though from another stock RS3 that will be indicative though.
I really need to get a new VBOX first.
Sent from my iPhone using Tapatalk
I've gotta put my hands up and say I never got these logs when the car was stock, apart from the drag runs. I have got data though from another stock RS3 that will be indicative though.
I really need to get a new VBOX first.
Sent from my iPhone using Tapatalk
#51
Posted 11 September 2016 - 01:23 PM
Shaunee
-
- Valued Member
-
- 609 posts
Valued Club Member
**Because there is so much to go through and document (that has taken place over one and half days), I'm going to document over the next few days and release updates as they're produced at appropriate points**
Engine Stage 1 Development
Apologies to those of you who understand the theory side of tuning, or those that are simply not interested. Something I like to do is provide some background physics explanation and/or theories, when I explain new elements that are being investigated and/or tested. Many people find this interesting and I feel it adds appropriate context to the what and why questions.
The old skool way of anything relating to “Stage 1” used to be exhaust, air filter and a carburettor rejetting and/or ignition timing alterations. Whilst methods may have changed since the “old days”, the principals remain the same.
In respect of the internal combustion engine: more air in (and more exhaust gas out), more fuel in, more ignition, bigger bang and what do we have……. more POWER!!
Luckily with modern set-ups, (read: ECU’s) and of course forced induction (turbo charging), the results can be quite dramatic, with relatively little effort.
Talking of turbo charging, whilst I suspect we know what this term relates to, do we all actually know how it works?
Simply put:
- air is effectively sucked in through the air filter; through the compressor side of the turbo (which, as the name suggests compresses the air to make it more dense by volume);
- through a cooling unit to increase/retain density, into the combustion chamber of each cylinder;
- this air is nice and dense (compared to an engine that is not turbocharged), so when you add fuel (proportionally) and introduce a spark you get a much bigger bang;
- on the downward stroke of the piston the exhaust gas passes through the exhaust manifold/headers (via the exhaust valves opening), through the turbo (exhaust side), which drives the compressor (compressor and exhaust on the turbo core work together - suck and blow air) and the cycle starts again.
Sounds quite complicated to explain but the physics are pretty simple.
Basic engine “tuning” nowadays (more so for turbocharged vehicles) normally relates to an ECU (Engine Control Unit) “remap”. Which crudely put, is done by changing values within the ECU “map”, which tells your engine what to do in relation to fuel, air and ignition.
Same as “old days”, just using different methods to control it all.
For the majority of us we don’t really care what this side entails. As long as we get the expected results, who cares what parameters have to be changed and for what reason…… but equally there are a number of us who are interested.
Mapping needs to be undertaken by a professional that really knows their stuff. Many people claim they are experts, but in my experience, this does not always relate to a good job. Whether that relates to a fast car (or not) or, probably more importantly, one that doesn’t grenade itself due to a bad map. In my opinion one of the biggest and most key decisions you’ll ever make when tuning a car, is who maps it and should you require this, who builds you an engine. NEVER take these decisions lightly. Do your research guys (as I’m sure some of you are already too well aware of).
Tuning Box - For Information
Whilst I was initially aiming (even up to the day of Day 1 performance tuning kick off) to look at tuning boxes first, a decision was made on the day to utilise the better method (in respect of overall results possible) of ECU tuning.
Just for added information though I will give some background information on tuning boxes...
Nasty way of tuning or actually a method that can work? I used to always think the former if I’m being honest.
Having been a part of the Ford and then the Subaru scene originally, you’d never dream of using a tuning box. In fact I never liked the idea of using these devices even with my daily diesel hack. However, I’ve always open to some testing and finding stuff out.
So what does a tuning box actually do (yeah, yeah - it tunes!!!)...
Whilst we’ve established the basics of air, fuel and spark make power, and we’ve also stated that modern engines control all of this via the ECU. Where does a tuning box fit in all of this then?
Most tuning boxes effectively sit between certain engine sensors, reading data going to or coming from a sensor, from or to the ECU. A tuning box can basically “alter” data between what is read in and what is sent out of it.
The most crude of tuning boxes will simply use a form of linear resistance bridged either over one sensor or between two. These types of tuning boxes would be best avoided in my opinion.
The most advanced ones have heavily populated data tables on them, which cross reference many things to provide safer control, across multiple sensors, and even allow you to make incremental changes to the overall settings of the box. This provides an element of flexibility for differing conditions and environments.
Even after doing my research on tuning boxes I still felt a bit uneasy, as “altering” data between the sensors and ECU never really sat well with me, as I was always concerned about the safety elements, that effectively the ECU would not be in total control.
This is where modern ECU’s appear to help the cause.
Modern ECU’s can have a lot of self learning and to a degree, on the fly mapping adjustment capabilities. Many ECU’s are now able to adjust fueling and ignition (within certain boundaries) based upon readings from a number of the engine sensors. So even if a tuning box requests more boost, the ECU detects that a fuel mixture is running lean and will add more fuel to compensate (again, being very simplistic). Assuming the tuning box works in conjunction with the ECU capabilities and engine, you could have quite a nifty setup available for a Stage 1 tune.
The single biggest advantage of a tuning box is because it sits between your ECU and sensors, it can be easily removed and (in most cases) undetectable - read: warranty friendly.
I would suggest the biggest downside (let’s assume the tune levels and setup is safe) is that a “proper” remap (which may also bring issues around warranty) of the ECU tables may provide better gains. Not always in peak figures for Stage 1, but a custom map of your car will probably net driveability gains.
Based on the testing I did with my previous A45, using a Tuning Box gave good results. I know Tuning Boxes still get bad press, but it’s my opinion that this can be largely down to how aggressive the Tuning Box map is, and the tables / protection on the ECU that it contends with.
I didn’t have any problems with the Tuning Box I used on my A45, but I know others have. I would also suggest that the tune on my Tuning Box was not that aggressive compared to some others. I think this was perhaps the reason why I never experienced issues.
Tuning boxes exist for the RS3, but I don’t know how these perform with data I have collected. Your own mileage may vary.
Getting An Initial Baseline
So before fitting / changing anything I needed to gain a baseline with the RS3 in standard guise.
Just for clarity we will conduct three runs for each test. The first one to ensure the engine, ancillaries and transmission are up to effective temperature, and the final two to gauge consistency of figures.
The MAHA dyno simulates quite a lot of load, and the runs can be longer than on some other dynos. As long as the dyno cell has proper/effective airflow, this won’t be an issue and it helps to ensure that appropriate load is being seen by the engine and ECU for each run (as you would see on the road).
Something else we’ll be making use of to ensure that we can gauge an element of satisfaction around what the ECU is seeing and how the engine is reacting, is to monitor detonation / knock. This is very important when you’re tuning a car, to appreciate whether or not you’re getting pre-ignition. This can be caused by all manner of things, and is ultimately bad news for your engine (damage to pistons, rings and crank bearings etc). I’m sure you’ve all heard of tuned engines that have melted a piston....... knock is one of your enemies.
The ECU will have it’s own knock strategy (many modern ECU’s are so powerful nowadays), and be surly recording any knock events (via a knock sensor located on the engine block) in it’s logs. It will use this information to “learn” (within certain boundaries), adapting ignition (by retarding) etc to reduce the occurrence of any knock event, once an event has been “seen”. Once we get into the ECU side of things we should be able to log this more effectively. We’ll be using a mixture of DET CANS and ECU logs whilst testing work is being done on the dyno and road, to ensure we can “listen” for any knock events that happen. This is in part, to make sure any level of tune is “safe”. In layman's terms, DET CANS consist of a microphone and a set of headphones. The noise of DET happening can be distinguished through the headphones, to a person who has a trained ear.
Dyno Corrections Used
I want to get this out of the way to provide ABSOLUTE clarity to the dyno results we will see throughout this project.
Nearly every dyno has a correction facility, which based on whatever correction factor is being applied, will use data from the environment (barometric pressure, inlet temps, ambient temps etc) in conjunction with a calculation to normalise the power readings. This is to ensure (any dyno accuracy of readings in general to one side) that it does not matter (to a degree) whether you dyno your car on a hot day or a cold day, your figures will be comparative. These correction factors are a leveller to normalise figures regardless of environment atmospheric conditions.
I would suggest that you only use a dyno that has corrections applied, for any reasonable power output figure.
The large majority of data and dyno set-ups in the EU will use the DIN correction factor. However, the latest correction factor that is being adopted across the EU now (and certainly by the manufacturers) is EWG. The short and tall of it is EWG will generally provide LOWER figures than DIN.
Make sure your dyno graph has a correction factor for starters, and then ensure any other graph you’re comparing with, is using the same factor. Don’t forget the differences can sway both ways as well.
If you compound correction factors with “optimistic” dynos, you’ll now start to understand why there is some major disparity with dyno numbers in the wild. Certainly with some of the figures being touted around the forums.
Just be open minded about all of this….. AND DON’T CONCENTRATE ON DYNO NUMBERS in isolation!
Since a lot of the comparable data in the community for the RS3 has been measured by using DIN, that will be the correction factor I’ll be using for the time being (it will be clearly marked as such on each graph).

#52
Posted 11 September 2016 - 04:17 PM
Fivepotfan
-
- Valued Member
-
- 868 posts
Valued Club Member
- LocationSouth of somewhere
Great stuff Shaun! Thanks for taking the time and effort for providing this level of info.
Really looking forward to the next installments.
now driving a 'Daytona Lite' FL car.
#53
Posted 12 September 2016 - 10:51 PM
Rs3443
-

- Valued Member
-
- 24 posts
Member
#54
Posted 12 September 2016 - 11:02 PM
Markevo6
-

- Valued Member
-
- 31 posts
Member
I'm hooked , this is so interesting .
I read your posts on the A45 and was blown away by the level of detail .
Looking forward to future posts, many thanks for taking the time to share this information with us.
I read your posts on the A45 and was blown away by the level of detail .
Looking forward to future posts, many thanks for taking the time to share this information with us.
#55
Posted 13 September 2016 - 08:38 PM
Shaunee
-
- Valued Member
-
- 609 posts
Valued Club Member
TEST 1 - Baseline Figure
Apologies as I’m awaiting the separate stock graph PDF to be sent to me. I’ll update this as soon as I have it. The graph is used on some of the overlays seen further on, so at least we have clear reference points at the moment to discuss.
Summary of Spec
Standard MY16 RS3
Fuel - VPower Nitro (99 oct)
TEST 1 figure achieved was 388bhp & 350lbft @ the flywheel
TEST 1 - Baseline Figure - Comments
Well we already appreciate how quick this car is, even in standard form on the black stuff. But in reality this is due to a number of things. The area under the curve, the gearbox and Haldex system - as a complete package it pretty much rocks, but what does the “pretty” graph tell us about the power delivery.
The area under the curve is always more relevant than the peak figures.
I can normally look at an entire power graph and make a decent judgement as to the potential of the power delivery and flexibility on the road, taking into account the power band and torque available. Make no mistake, it’s the torque that gets you to where you want to go…. Quicker.
Since the MAHA RR is able to appropriately load the engine up, you can deduce how the turbo comes on song. You can see here that you’re achieving near (around 340lbft) peak torque at around 2600rpm, which in 4th gear is pretty good. Suffice to say, due to loading, you will see peak torque coming in slightly earlier the higher the gear. So 5th would see this 2800rpm drop slightly….. this is all normal (3rd gear would be slightly later and so on).
Low rpm’s for torque makes for more pace from lower revs, however by looking at this torque curve you see the RS3 holds this torque pretty well all the way through to 5800rpm. For a road car that is a nice torque band. This is why the mid-range feels really strong on the RS3 and explains why the engine keeps pulling through the rev range. When you combine a wide torque band, with an early onset of torque, you end up with a very agile package.
There are a few peaks and troughs throughout the torque curve, but these don’t really “get in the way” of the power delivery. We’ll come on this later.
When we also see how much more power/torque this turbo can provide further on, it makes the overall set-up even more amazing.
So what else can we find out?
Another advantage of most rolling roads is that you can also capture and overlay other data, that is gathered at the time of the dyno run. This data either comes from plugging the dyno into your OBD port, or buy connecting additional sensors to the dyno, directly connected to the car.
I did capture a lot of data on all runs but it was a mix between additional sensors (true wide band sensor), ODB to dyno and also using VCDS. Which leads me on to the next subject….
VCDS (previously known as VAGCOM)
I won’t bore you guys with talking about what VCDS is…. I’m suspecting most of you guys know, but what I will concentrate on is talking about the logging facilities as this was the real reason why I purchased VCDS.
In basic terms the ECU reads a varied number of sensors (some dependant on OEM ECU version). Upon looking at the sensor readings available via VCDS, you may be overwhelmed by what data sets can be logged.
You may be thinking why I can’t just plug in a simple OBD reader into the car and use a smartphone app etc to read the sensors. The main constraint with this is that these loggers / scanners only read generic OBD codes (PID’s) generally. Some applications will also decipher / read manufacturer specific codes, but not to the extent that VCDS does. VCDS reads all the VAG sensors that I’m aware of, and it’s access to this information that I wanted.
Whilst some may be meaningful, others will have the reaction of "What the hell does that mean?". Obviously to a professional or knowledgeable enthusiast, this will equate to useful data but in reality the majority of us will neither understand or be interested to a degree...... but make no mistake they can all be meaningful.
Here is a screenshot of a log I took (excuse the rather slow sample rate - that’s my fault) for the stock level of tune.
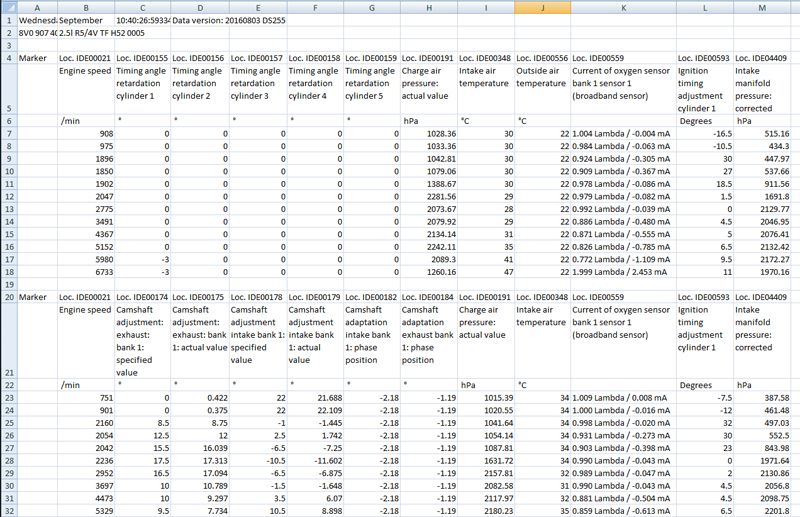
This specific screen shot shows two logs in the same file.
They both contain all sorts of data varying from timing retard per cylinder, boost, charge air temp and ambient temps, fueling, overall ignition, camshaft timing etc. You can view all sorts of useful date which is very very useful (needed) when you’re mapping. All of these are normally recorded against RPM.
There are so many different sensors and you can log up to 12 different sensors at a time in VCDS.
Stock Boost
As we’re talking about the stock tune here, you can use the screenshot above to see how much boost the car makes on a stock tune as seen at the manifold.
If you look at the Engine Speed column on the left (uppermost log) and scan across to the last column (Intake Manifold Pressure), you’ll see what boost was achieved at what RPM. Whilst the sample rate is quite slow (as in the RPM increments), this does give you a good idea of boost attained at the manifold.
You must remember that the boost shown includes 1 atmosphere of measure as these are absolute readings, so you must take 1 atmosphere (1 bar effectively) off to get an appropriate reading. These are also shown in hPa as opposed to PSI or BAR. 1000 hPa is basically 1 bar, so it doesn’t take long to work it all out.
I’ll do the conversion to BAR to make it easier for you to read:
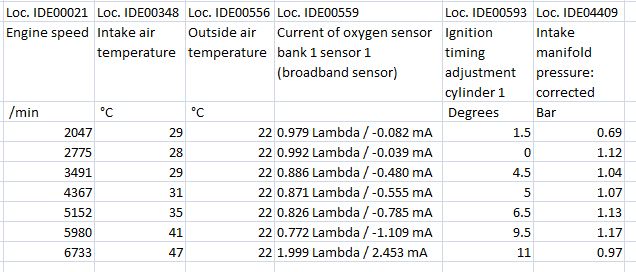
Whilst it doesn’t show it in this log, stock boost peaks at around 1.2bar, but you can see that boost does fluctuate throughout the rev range. This is also shown in the torque curve, which for a standard car isn’t that flat to be honest. On the stock dyno runs of the RS3 you can see the torque (and power) fluctuate through the mid range, and this is largely due to boost fluctuation / control. Boost control could have been tighter to be honest, but it is what it is.
As you may expect, you can see boost tails off towards the redline (just below 1bar).
Charge Temp
Something else you can see on the above log is the Intake Air Temp which is the temperature of the air after the intercooler. This is very important for turbocharged cars and is certainly an area that can cost you power as well as gain you power.
Effectively the cooler the air entering the engine after the turbocharger (and intercooler), the more dense it is and the the bigger bang you can achieve. Figures you attain here can inform you whether you’re over heating the charge air (by running the turbo beyond its efficiency) and/or have an effective intercooler.
It’s also useful to log the ambient temperatures so you can see the delta (difference) between the two temps.
You’ll see here that the charge temp (intake) is fairly OK, but rises as the run moves through the revs and more boost is being applied and everything heats up.
Cooler charge temps are the best (icing issues to one side), but I was always told in the old days that ideally you should aim for charge temps below 40degs. Anything over that will apparently start to impact power more.
Considering this is a dyno cell, and although it has very good airflow, it can’t match the cooling the car would receive on the road, so the figures attained here on the oem setup are OK. Repeated dyno pulls will start to increase temps, but on the runs we did they quickly stabilised again.
Fuelling
Again on the same log above you’ll see fuelling being logged (shown by the column giving a Lambda reading). Ignoring the last row @ 6733 (the throttle was lifted here), the Lambda figure slowly decreases as the revs rise. This means the fuelling starts off lean (more air than fuel) and gradually richens up (more fuel) as the power / boost rises. What you would expect.
It is possible to gain power (and lose it) depending on what fueling strategy you choose. Rich or lean mixtures have their benefits and disbenefits. However, I’m led to believe that with direct injection (as used in the RS3), you have much more flexibility with what you can do with the fuelling.
Ignition
The final element to highlight is the ignition adjustment, which is also on the same log above.
Again, as the rev rise and boost builds the ignition is slowly adjusted, with stock peak ignition adjustment running at around 11degs of advance.
All the above are the basic elements to consider when tuning a turbocharged car. There are a lot more, certainly in this ECU on the RS3, but these are the basics. But you’ll probably appreciate now how important log information can be, especially when you’re looking to start tuning a car.
So with the benchmark data logged and the car pulled off the dyno…. Let’s move on to the first item to change.
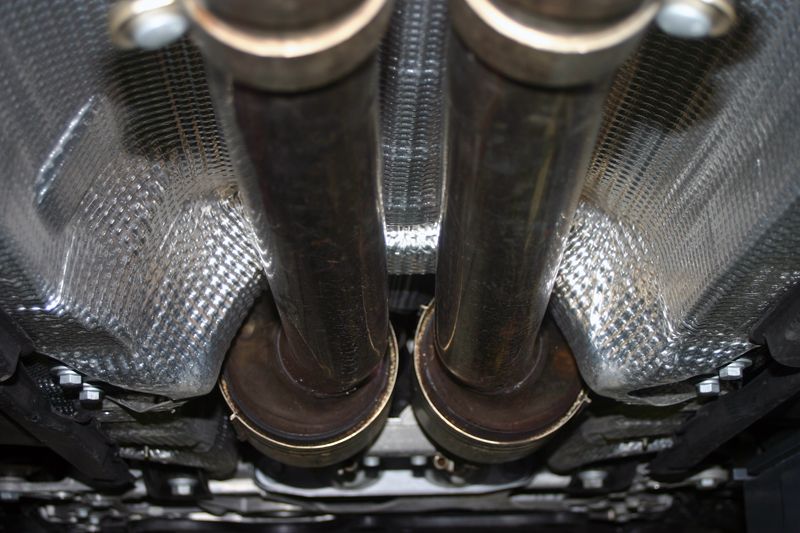
Secondary Decats
Quite a common mod on the RS3 so I thought it would be rude not to.
The RS3 has several cats, both in the downpipe and the secondary mid section. It’s the secondary ones I decided to remove as it’s a fairly straight forward and inexpensive mod.
To be honest the OEM exhaust system doesn’t look that restrictive visually, but may need to be looked at further down the line.
You’d have thought that removing a couple of cats would release some power. We’ll find out.
The main reason I chose this mod was for the noise increase though. Whilst the stock car sounds very nice, I wanted to unleash that rumble a touch more. If we saw any increase in power that would be a bonus, but it wasn’t really expected from my perspective.
These are what we’re going to remove:
These are what we’re going to replace them with, a set of Miltek secondary decat pipes:

With both sets side by side:
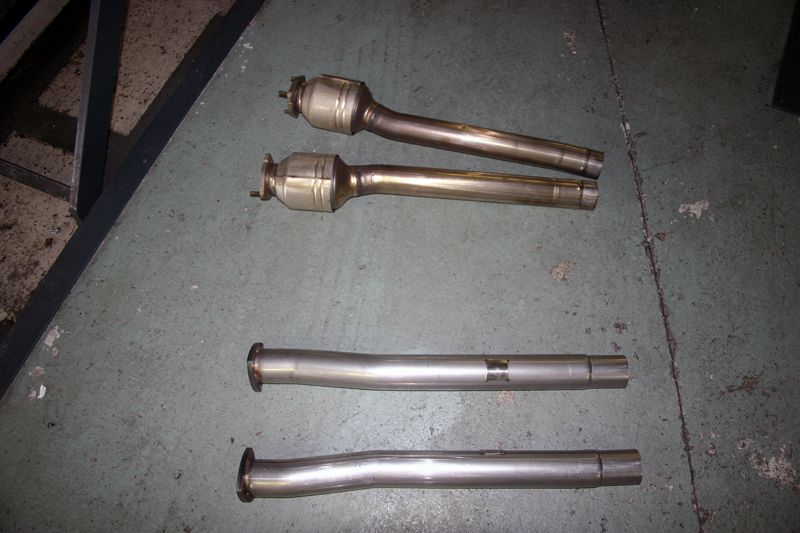
It’s clearly quite obvious what the difference is between the two sets of pipes!
So with the new decats on, it was time to bang the car on the dyno and see what we could see.
TEST 1 - Secondary Decats
Apologies as I’m awaiting the decta graph PDF to be sent to me. I’ll update this as soon as I have it.
Summary of Spec
MY16 RS3
Miltek Secondary Decat Pipes
Fuel - VPower Nitro (99 oct)
TEST 1 figure achieved was 394bhp & 355lbft @ flywheel
Because I haven’t got the graph in front of me I don’t have the exact figures (again apologies), but from what I remember we saw circa +6bhp and +5lbft over stock. I can’t remember whether this was only peak or throughout the rev range though. I’ll update when I get the graph in my hands.
I know others have reported more increases, but unfortunately I can only state what I
achieved. To be honest I’m not surprised.
Looking at my VCDS logs it doesn’t appear to have affected boost control, which if there was less of a restriction on the exhaust side by a tangible amount, I would expect to see changes in wastegate duty / boost achieved.
It’s sounded awesome on the dyno though….. It has a proper “growl on” when you open it up. Worth the cost 100% just for that in my opinion!
I was going to disconnect the exhaust valves as well, but never got around to it. I might revisit that in the future.
I also can’t tell you whether driveability was affected, not that I would expect this to be the case in reality to any noticeable degree. The first time I got the car on the road was after the next stage of tuning….. Which we’ll come on to next and something I’m sure you guys will be more interested in.
Edited by Shaunee, 13 September 2016 - 08:40 PM.
#56
Posted 13 September 2016 - 09:21 PM
Fivepotfan
-
- Valued Member
-
- 868 posts
Valued Club Member
- LocationSouth of somewhere
Top post again Shaun - well done! Keep em coming, this is great stuff!
Edited by Fivepotfan, 13 September 2016 - 09:21 PM.
now driving a 'Daytona Lite' FL car.
#57
Posted 13 September 2016 - 09:40 PM
monopole
-

- Banned
-
- 1,150 posts
quattrophenia
- LocationLimbo
+1
some serious info and extensive levels of technical detail, you'll start to worry some readers with your knowledge of tuning and logging 
MY16 Glutorange RS3 - how the hell did you not see me coming!
"always do what you always did and you'll always get what you always got"
#58
Posted 13 September 2016 - 09:45 PM
Shaunee
-
- Valued Member
-
- 609 posts
Valued Club Member
I'm ONLY an enthusiast. I'll leave the real stuff to the professionals!
If truth be told I just like getting involved and learning. Perhaps that's a tuners worst nightmare! Ha
Sent from my iPhone using Tapatalk
If truth be told I just like getting involved and learning. Perhaps that's a tuners worst nightmare! Ha
Sent from my iPhone using Tapatalk
#59
Posted 14 September 2016 - 02:54 AM

 View Garage
Reply to this topic


